5 Powerful Google Ads Stats & How to Read Them
The Google Ads platform contains a built-in suite of exceptionally informative statistics and charts.
However, it can be hard to know which stats are worth focusing on, what certain terms mean, and how to interpret the information that Google Ads provides.
This article will define some of the most common terms that appear throughout Google Ads’ stats, and highlight and explain some of the stats we think are the most helpful for a business to be aware of.
If you’re looking for more information on one statistic in particular, or you need an experienced company to handle your Google Ads campaigns for you, get in touch with us at HomeRank Ads, or follow our blog for regular online ad tips.

Important Terms
Google Ads uses a variety of advertising-specific terminology to explain different statistics. For a complete glossary, refer to Google’s official page.
This abridged list of definitions are the terms that are most relevant to the stats that will be covered later in this article:
Clicks - The number of instances of people actually clicking on an ad after seeing it.
Conversions - This is a variable term that helps measure how many leads an ad has led to. Within a website, you can install a conversion tracker that keeps a record of when certain events happen and counts each occurrence of that event as a lead. Many websites that use online marketing have a contact form, and one of the most common ways to track conversions is to keep track of how many online visitors fill out and submit the contact form.
Cost - The amount of money spent on ads over a period of time.
Cost-Per-Conversion - How much money was spent on average to get one conversion, calculated by dividing cost by the number of conversions.
For example, if you spent $800 on ads for one month, and got 15 conversions, your Cost-Per-Conversion would be 800/16, or $50.
CPC (Cost-Per-Click) - How much money was spent on average to get one click, calculated by dividing cost by the number of clicks.
For example, if you spent $800 on ads for one month, and got 140 clicks, your CPC would be 800/140, or $5.71.
CTR (Click-Through-Rate) - A ratio of how many people clicked on your ad compared to how many people saw it, calculated by representing the number of clicks as a percentage of the number of impressions.
For example, if your ads had 140 clicks for one month and 2000 impressions, your CTR would be 7%.
Impressions - The number of times the ads were shown to people as they browsed the internet.
Analyzing Traffic

You can change the line graph to show the exact data you want.
When viewing the “Overview” tab of your Google Ads account, you will see a chart similar to the above image near the top of the page. By selecting different options from each of the four coloured drop-down menus, you can customize what the line graph shows.
We recommend setting your chart to show Clicks, Impressions, CTR, and Cost to get a general idea of how your ads are performing.
The two main metrics to focus on in order to gauge the traffic your Google ads are generating are Clicks and Impressions.
Clicks tell you how many people are clicking on your ads, while Impressions tell you how many people are seeing your ads. The CTR brings those two metrics together to tell you the percentage of people who see your ads and then also click on them.
Your goal should be to increase your CTR as you continue to develop, plan, and refine your ads.
NOTE: If you are doing ads for an exceptionally popular business with a broadly appealing topic, such as a store for clothes, you may have a lower CTR than expected.
This is because your ad is being shown to so many people that your Impressions metric is very high, making the CTR ratio drop. Your main goal should still be to increase the CTR overall, but don’t be discouraged if it begins lower than you thought.
High impressions but low clicks?
This means that Google thinks your ads are worth showing to people (perhaps they use diverse language, trendy keywords, or focused headlines), but people aren’t clicking on them. Try to improve your ads with a broader array of keywords, or change the language to be more specific to your target market.
High clicks but low impressions?
This is what you want. It means your CTR is high and you’ve focused on the right audience; many of the people who see your ads click on them.
Keyword Performance
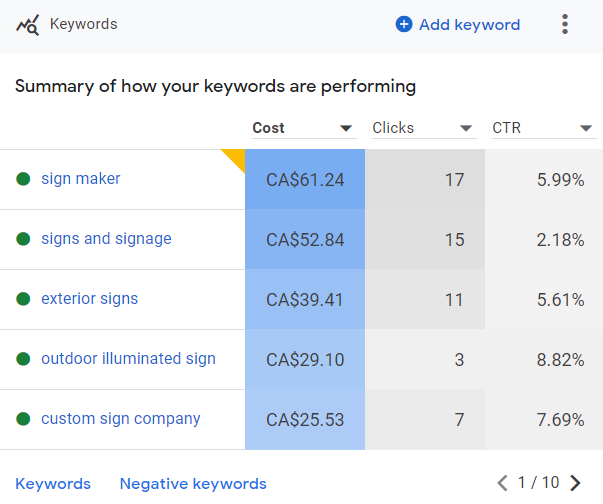
This is a sample of signage-related keywords.
After Google has been given a budget for an ad campaign, it will not simply divide that budget between all chosen keywords. Fortunately, it’s much smarter than that.
What actually happens is that Google uses its algorithmic data and knowledge of what types of keywords it predicts will be successful to assign different amounts of money to each keyword.
In the main Overview tab, you can find a graphic resembling the example above. In this example, Google spent the most money showing the “sign maker” keyword to potential customers, and accordingly, it got the most clicks.
However, the “custom sign company” keyword at the bottom of the list has a very high CTR, so it may be worth telling Google to focus more on that keyword by changing individual keyword budgets, or “bids.”
How to Change Individual Keyword Bids

Adjust the budget for different keywords if your ads aren’t reaching the correct audience.
From the left sidebar menu, select the Campaign you wish to edit, then the Ad Group you wish to edit.
Click the “Keywords” tab on the left sidebar menu.
You will be shown a list of all keywords contained within your selected Ad Group. Click the small box to the left of the keywords whose bids you wish to modify.
That will take you to a menu that will look like the picture above. From this menu, you can increase or decrease individual keyword bids in order to guide Google on which keywords you think it should promote the most.
The columns to the right, showing various stats, can be modified by selecting the Columns button and customizing what is displayed.
Location Interaction

There’s no point wasting ad budget on zones you don’t service.
The Overview tab also shows the above breakdown of how much engagement you’re getting from which postal codes.
By mousing over the different outlined zones, you’ll be able to see the results for each one. The metric being displayed in this example is Impressions, but you can change it to whatever you like.
On the sidebar on the left, under “Show More” at the bottom, is a Locations tab where you can browse how much money Google has spent on each zone. After seeing the location-based results as above, you can individually change the budget for different zones to direct Google to adjust what geographic areas it shows ads to.
Seeing the specific metrics from individual postal codes allows you to discern if your ads are reaching your targeted geographic market.
Most businesses want their ads to target their local market. Avoid targeting cities or regions beyond your own city unless you have a focus on intra-city shipping.
And of course, each urban area will have certain industries that it cares about more than others. For example, in Toronto, hot industries include real estate, construction, and green technology, so a business providing services related to those industries will want to make sure that in their Location results, Toronto is a hot spot.
Day & Hour Performance
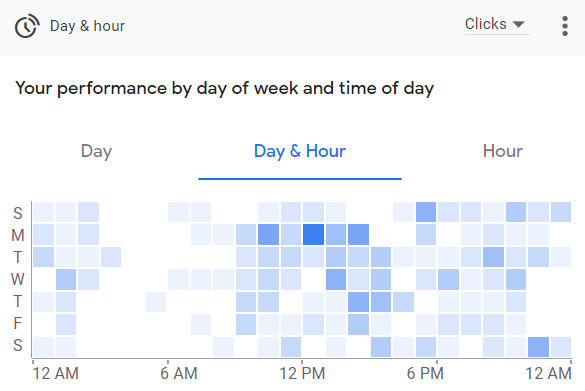
To maximize your budget, don’t spend money during slow times of day.
Found on the Overview tab, the above Day & Hour Performance heatmap is a great tool for optimizing your budget.
This graphic will show you what times of day people are seeing or interacting with your ads. Significantly, this shows you the times of most and least traffic. Telecom companies say that most people are online between 7pm-11pm, although the specific engagement times for your ads may vary.
Just below the chart shown above will be a button that says “Ad Schedule.” If you click that button, you’ll be presented with a breakdown of what time of day your ads are being shown. Alternatively, you can click the “Ad Schedule” tab on the left sidebar menu to find the same information.
To make the best use of your budget, adjust the hours your ads are being shown so you don’t waste money running ads when no one is looking at them.
This tool is most useful if all your business is happening within a single time zone. If your business is trying to target an international audience who are interacting with your ads at all times of day, then the heatmap may not show clear low or high traffic times.
Demographics
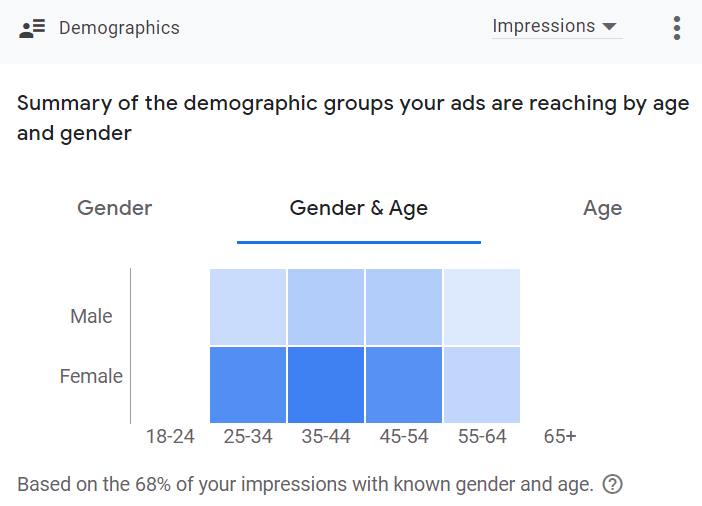
Different businesses will find they appeal to different genders and age groups.
The last of the useful Google Ads stats we’ll be looking at is Demographics.
Also found on the Overview tab, this chart shows what Google has learned about the gender and age of the people interacting with your ads.
While not the most in-depth demographic tool, it’s still very helpful to know if your ads are in fact reaching your target audience or demographic.
We know men and women have very different spending habits. For example, according to a study by Forbes, women spend 76% more money on clothes than men, while men spend almost twice as much as women on vehicles. Therefore, if your business is something like an online clothing store, it makes sense to try to work your ads so that they are being seen primarily by women.
If you know that your industry targets a specific gender or age range, you can use the above data to inform your business strategy, or as an indication to adjust the phrasing of your ads if the wrong demographics are coming up.
Trust HomeRank to Help You Develop Powerful Google Ads
With over 15 years of experience, HomeRank specializes in bringing exceptional digital advertising success to businesses that aren’t traditionally online.
Google Ads provides powerful statistical tools, and HomeRank is here to show you how they can best be used to grow your business.
Whether your business deals in landscaping, real estate, home renovations, construction, or anything else, HomeRank has the expertise and strategies to introduce your company to online success.
Using our expert knowledge, we can establish a Google Ads campaign according to best principles, and refine and improve it month after month to maximize your online traffic.
For more details, pricing information, or answers regarding anything else, get in touch with the experts at HomeRank today.